Positioning · CFTC COT
large specsKey levels · classic pivots (prior session)
Institutional COT.
Forex Client Sentiment
Real non-commercial (speculator) positioning from the CFTC Commitments of Traders report — the weekly gold standard for institutional FX futures data. Published every Friday at 15:30 ET covering the preceding Tuesday.
More longs than shorts among large speculators. When longs exceed 75%, the trade is crowded — smart money often fades extremes.
More shorts than longs. Extreme short positioning (>75%) can signal exhaustion — short squeezes become more likely.
Near-equal positioning with no strong directional lean. Wait for a catalyst to tip the balance before taking a directional view.
COT data is best used as a contrarian indicator at extremes, not as a trend-following signal. Always combine with technicals and macro context.
What is "non-commercial" positioning? The CFTC splits traders into commercials (hedgers — airlines hedging fuel, exporters hedging receivables) and non-commercials (large speculators — hedge funds, CTAs, and proprietary traders). Non-commercial positioning is the best proxy for "smart money" directional bets in the futures market.
Why is this contrarian? When speculator positioning reaches extreme levels (>75% net long or net short), the trade is crowded. There are few participants left to push price further in that direction, and a catalyst can trigger rapid unwinding. Historically, extreme COT readings have preceded significant reversals in EUR/USD, GBP/USD, and USD/JPY.
Limitations: COT data is published weekly with a 3-day lag. It captures futures positioning only, not spot or OTC markets. Use alongside technicals, fundamental analysis, and the live desk signals above for best results.
FX news.
Forex and central-bank headlines
Currency headlines, central-bank drivers and data releases that can reset dollar and risk appetite.

investingLive Americas market news wrap: War worries boost oil to the highest since May
Baker Hughes US oil rig count rises 1 to 460. Total rigs unchanged at 603US expected to remove 50% tariffs on some Canadian products as soon as today - reportUMich…
Read storyTrump: We may do another operation against Iran
Trump at a rally says they may do "another operation" against Iran.We may do another little Epic FuryWe'll…
Read story
SpaceX perpetual futures traded about $6 billion after earnings
Talos’s combined Binance and Hyperliquid turnover figure rose sharply while Binance’s dollar exposure contracted; actual retained fees remain…
Read story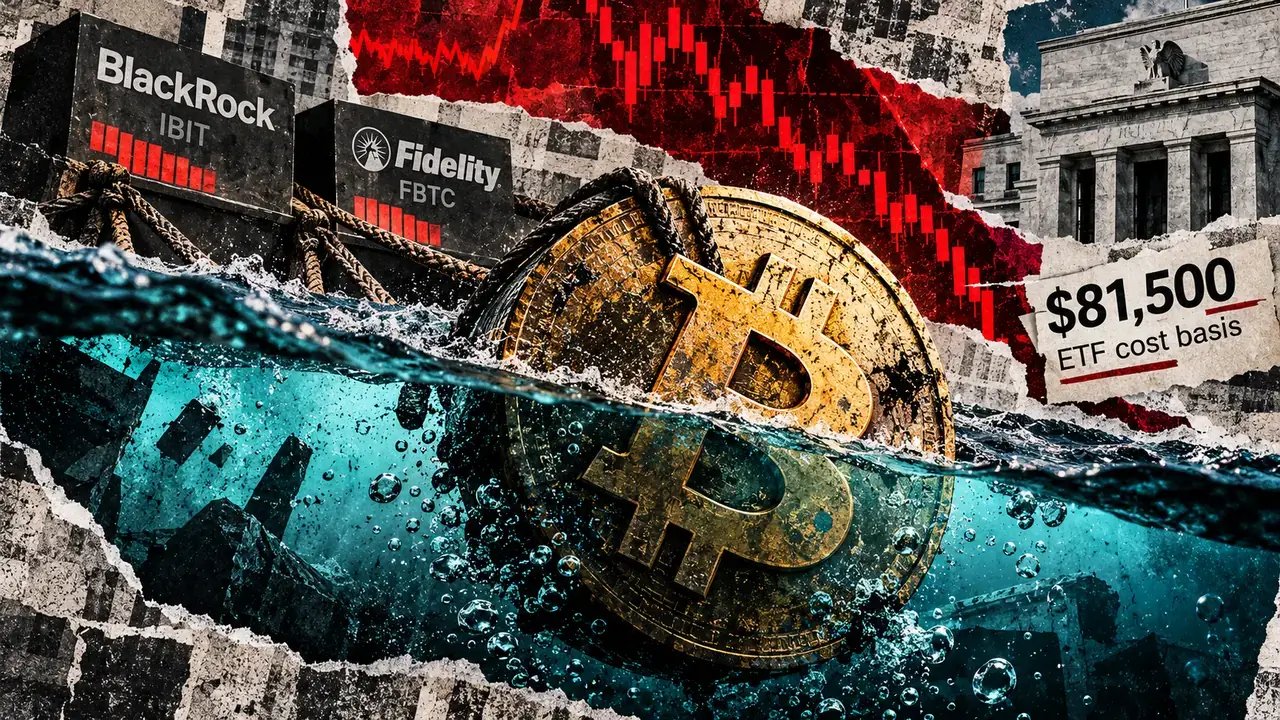
Bitcoin ETFs shed $635 million as BTC tests their holdings’ estimated $81,500 cost basis
US spot Bitcoin exchange-traded funds recorded about $635 million in net outflows Thursday as the cryptocurrency traded near…
Read storyUS expected to remove 50% tariffs on some Canadian products as soon as today - report
Election season is doing what trade negotiators couldn’t.The Wall Street Journal reports the US is preparing to lift…
Read story
BTCC Exchange Q3 2026 Growth Report: 0-Barrier Trading Powers a $387B Quarter, With TradFi Volume Up 6x to $16.3B
BTCC, the world’s longest-serving cryptocurrency exchange, today released its Q3 2026 Growth Report, highlighting the flagship 0-Barrier Trading…
Read storyUMich final October final consumer sentiment 48.0 vs 46.3 expected
Prior was 46.3Prelim was 48.1Current conditions 46.7 vs 50.9 priorExpectations 48.4 vs 46.3 prior1-year inflation 4.7% vs 4.7%…
Read storyBank of Korea Wants Stablecoins Written Into Forex Law as Crypto Bill and Tax Fight Come to a Head
Bitcoin Magazine Bank of Korea Wants Stablecoins Written Into Forex Law as Crypto Bill and Tax Fight Come…
Read storyUS S&P Global flash October services PMI 57.9 vs 58.0 expected
Prior was 59.8Manufacturing 56.0 vs 55.5 expectedPrior manufacturing 57.0Composite 57.6 vs 58.4 priorselling prices rose at the sharpest…
Read storyCanada August retail sales +1.2% vs +1.3% expected
The advance August reading was +1.3%Prior was -0.7%Sales up in all 9 subsectors, led by motor vehiclesEx-autos +1.2%…
Read storyinvestingLive European session wrap: Equities cautious as Treasury yields rebound, oil holds firm
Headlines:Falling Treasury yields may be hiding a darker story about the AI boomCrude oil extends gains as Saudi-Houthi…
Read story
Base Active Addresses Jump Another 50% as Transactions and Fees Fall
Transactions fell 8.7% and dollar-denominated user fees dropped 20% on Oct. 22 as a GMGN trading competition continued.
Read story
South Korea to amend forex law to regulate stablecoins as payment instruments: report
South Korea is currently developing the Digital Asset Basic Act, which seeks to establish a comprehensive framework for…
Read story